Flow cytometry has become one of the most important tools in immunology research. The basic principle of this technique is the fluorometric analysis of samples on a single cell level. In the following section detailed information on flow cytometry will be provided including:
- Principles of Fluorescence
- Fluorochromes (definition, functions, different types)
- Principles of a Flow Cytometer (fluidics, optical systems, electronics)
Principles of Fluorescence
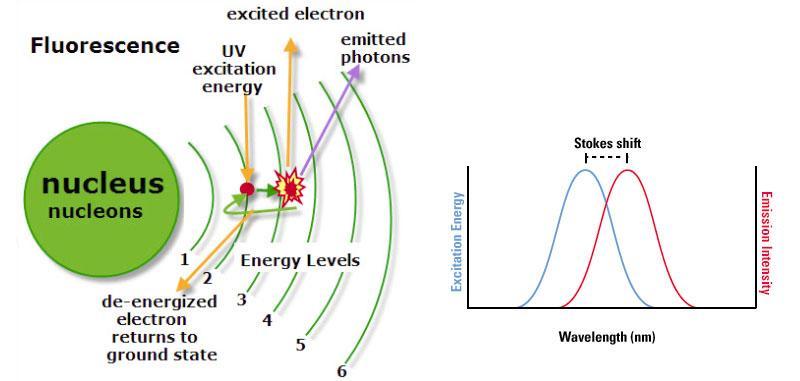
- Fluorescence describes a process, in which a molecule (see section Fluorochromes) emits radiation, especially visible light, during exposure to external radiation (e.g. a laser beam).
- Flow cytometers possess one or multiple lasers that produce laser beams of precisely defined wavelengths (excitation wavelength).
- When the laser beam encounters the fluorochrome, photons are absorbed
- As a consequence, electrons are excited to a higher energy level (Figure 1, left).
- Once the electrons fall back to their ground state, energy is released as a mixture of heat and light (fluorescence).
- Thus, the emitted light (emission wavelength) has less energy and therefore a greater wavelength.
- The difference of the maximum of excitation and the maximum of emission wavelength is termed Stokes Shift (Figure 1, right).
Fluorochromes
- Fluorochromes are molecules that absorb light of a particular wavelength, followed by the emission of light at a higher wavelength (see Principles of Fluorescence).
- Color and intensity are characteristic features of a fluorochrome.
- Fluorochromes are widely used in histology and immunology in order to elucidate tissue structures and cell populations, respectively.
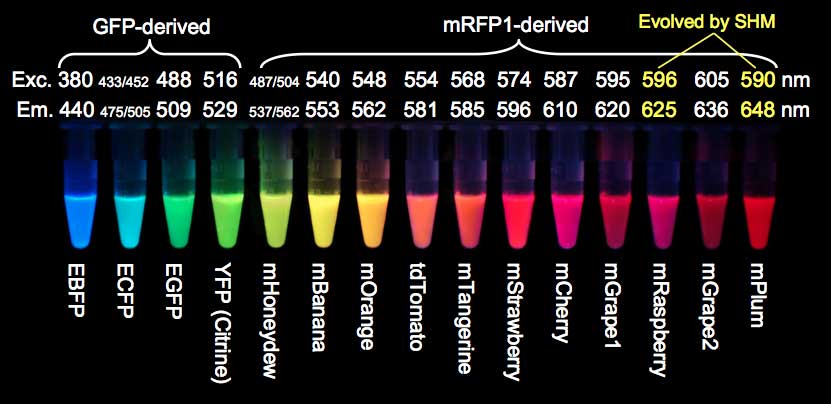
- Two very commonly used naturally occurring fluorochromes are Green Fluorescent Protein (GFP, derived from the jellyfish Aequorea victoria) and Red Fluorescent Protein (RFP, derived from the mushroom anemone Discosoma).
- Today a whole palette of natural fluorescent proteins is available (Figure. 2).
- Today a large variety of synthetic Fluorochromes are available, e.g.
- Alexa488
- Fluorescein isothiocyanate (FITC)
- Pacific Blue
- Phycoerythrin (PE)
- For more information visit: bdbiosciences.com/sg/research/multicolor/spectrum_viewer/index.jsp
- So-called Tandem-Dyes have been designed, which are two covalently attached fluorochromes, of which one serves as a donor and the other as an acceptor. The donor of the tandem is excited at a particular wavelength and transfers the energy to the acceptor. Characteristically, Tandem-Dyes show a greater Stokes shift than single fluorochromes.
- Examples for Tandem-Dyes are PE-Cy5, PE-Cy7, and APC-Cy7
- Fluorescent proteins and the synthetic fluorochromes are widely used.
- Especially synthetic fluorochromes conjugated to antibodies, which allow for a precise targeting of epitopes of interest, have greatly advanced immunology research.
- Today, companies sell an enormous range of antibodies that are specific for intracellular or cell surface proteins/antigens (e.g. CD3 on T cells).
- These antibodies can be obtained in many different versions (CD3-Alexa488, CD3-PE, etc.)
- Once you have designed and applied your flow cytometry panel of differently fluorochrome-labeled antibodies, your cells are ready to be analyzed by a Flow Cytometer.
Principles of a Flow Cytometer
In the first part of this section, we have explained what fluorescence in general means and described different types of fluorochromes. We learned that fluorescence measurements are commonly used in immunology research. Today, an enormous variety of specific antibodies is available, which are coupled to one of the many different fluorochromes. A delicate selection of these fluorochrome-conjugated antibodies allows for a simultaneous in-depth analysis of precious cell samples.
Now, we will focus on the technical aspects of Flow Cytometers. The development of the first Flow Cytometer dates back into the late 1960s. The basic principle of a Flow Cytometer is the measurement of the cells´ physical characteristics (relative size and granularity) and fluorescent signals.
Therefore, Flow Cytometers are equipped with three major components: fluidics, optics, and electronics.
Fluidics
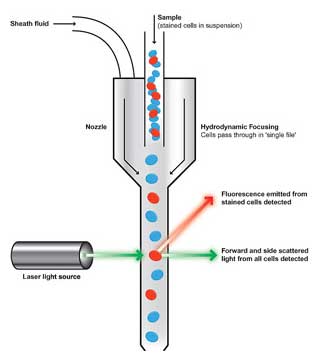
- Flow Cytometers need to analyze samples on a single cell basis.
- The sample preparation enters the Flow Cytometer through a nozzle (typically 70-130 µm in diameter).
- A process called hydrodynamic focusing ensures the order into a stream of single cells.
- Due to slight pressure differences the surrounding sheath fluid runs faster than the sample fluid and creates a drag effect.
Optics and electronics
- After cells have been arranged in a single cell order by hydrodynamic focusing, they pass through the optical part of the Flow Cytometer, where they encounter one or more beams of (laser) light.
- Lasers generate a precise wavelength of light that is responsible for the fluorescent effect of fluorochromes (see Principles of Fluorescence).
- Different laser lines (they range from UV to far red) excite different fluorochromes that, together with light scattering, provide useful information about the sample to be analyzed.
- During the collection of the sample by the fluidic system more and more cells pass the various laser beams.
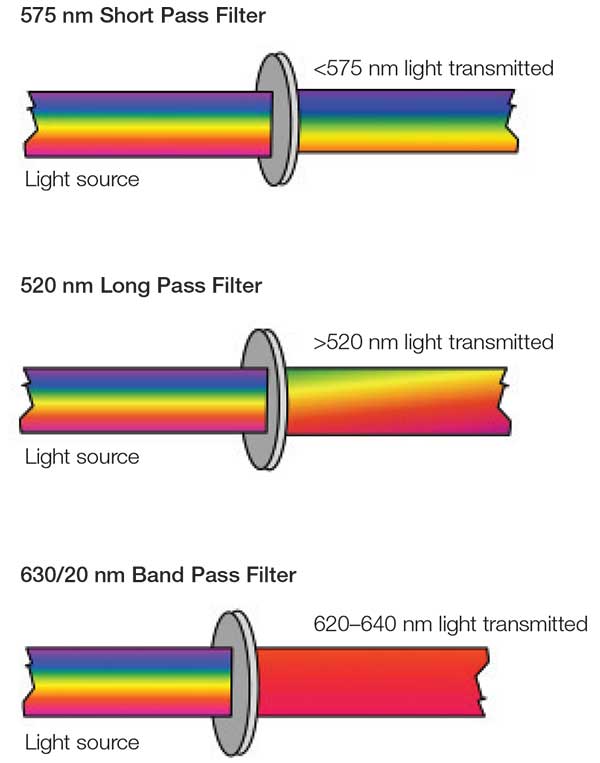
- The different fluorochromes emit light of varying wavelengths, which can partly overlap.
- Therefore, a delicate filter system is mandatory. Otherwise a separation of simultaneously detected signals might not be possible.
- Three main filter types are available: long pass filters, short pass filters, and band pass filters (Figure. 4).
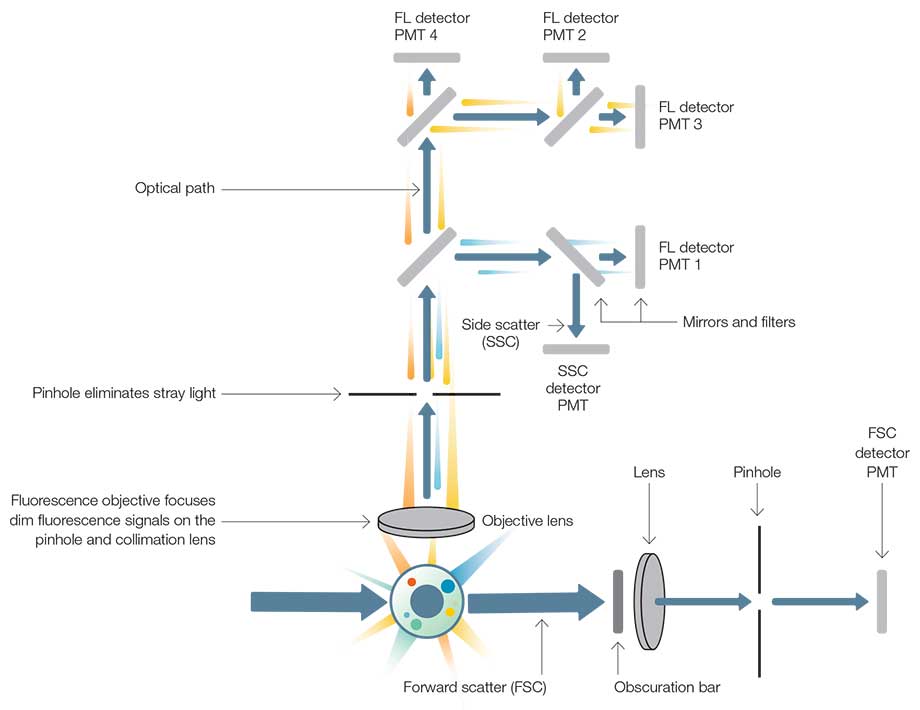
- The fluorescence signals follow an elaborate network of filters and detection systems (Figure 5).
- Light scattering and fluorescence signals are detected in separate channels by so-called photomultiplier tubes (PMT).
- In the forward scatter (FSC) information about the cell size are collected.
- Signals in the side scatter (SSC) provide information about the granularity of the cell.
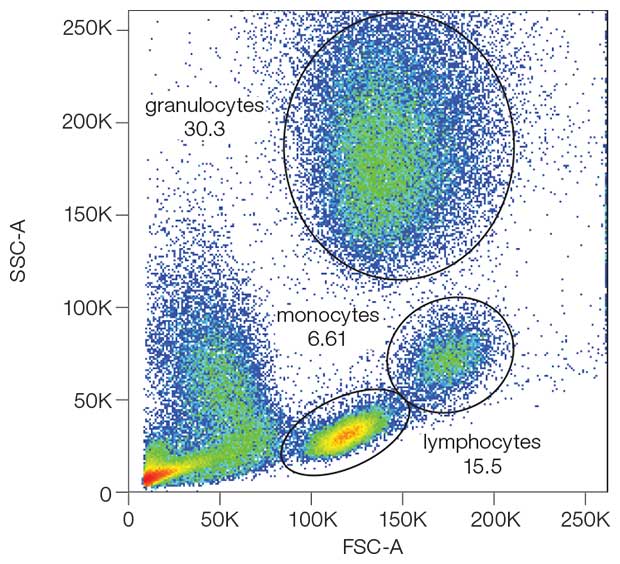
- FSC and SSC can be used to broadly distinguish between different cell types, e.g. in the human peripheral blood. However, this requires much expertise and is far from being precise.
- Thus, Flow Cytometers are equipped with additional light channels and detectors (PMT), where they detect fluorescent light.
- The detection of light scattering and fluorescent signals is based on the generation of a pulse (“event”) at the PMT detector.
- A so-called analog to digital converter (ADC) translates the analog current at a given PMT into a digital value (dot plot, histogram, etc.) that can be interpreted by the researcher using appropriate software, e.g. Flowjo (Figure. 6).
- Before you start to design your own multicolor Flow Cytometry panel, online tools are available to help you e.g. bdbiosciences.com/sg/research/multicolor/spectrum_viewer/index.jsp
- The following parameters can be adjusted:
- Type of Flow Cytometer
- Number of laser lines and their excitation wavelengths
- Applied Filter settings
- Fluorochromes you desire to use
- As a result the fluorescence spectrum viewer shows you, which fluorochromes can be used simultaneously under these circumstances.
- However, before analyzing multicolor samples, a procedure called “compensation” is mandatory, which will not be part of this section. You will learn more about compensation during the practical course. Further information can also be found here: bdbiosciences.com/documents/Compensation_Multicolor_TechBulletin.pdf
Flow Cytometry Approaches in Cancer
- In recent years, a rare types of cancer stem cells (CSCs) have been identified as the responsible population of origin and recurrence of a growing list of tumors.
- Thus, the establishment of reliable methods for the effective isolation of CSCs should be imperative.
- Mutiparametric flow cytometry is a powerful tool that allows qualitative and semi-quantitative evaluation of cellular characteristics like relative cellular size and relative cellular complexity, taking advantage of light dispersion and emission properties when suspension cells are analyzed one by one passing through a beam of light.
- In addition, cells can be labeled with specific antibodies that recognize surface or intracellular molecules, and that when coupled to fluorescent components makes these powerful detection probes.
- Once cells are labeled, they can be purified from the original suspension using sorting technology on flow cytometers, with the capacity to retrieve them in sterile and optimal conditions to conduct further experiments.
- A common issue in Flow Cytometry analysis is the overlap of the spectrum of fluorescent molecules, limiting the number of detectors and analysis parameters.
- One innovative development is the combination of flow cytometry with mass spectroscopy (Cytometry by time of flight, CyTOF), based on the same principle as a flow cell but instead of fluorochromes, it uses antibodies coupled to heavy metals, which can be reliably distinguished according to their atomic mass.
- Although this technology offers great advantages such as the ability to analyze up to 34 parameters simultaneously, the cells cannot be recovered because the procedure requires the vaporization of the coupled atoms in order to ionize the heavy metals (Bendall et al. 2011).
- For solid tumors like breast, colorectal, pancreatic and prostate, the marker used marker for CSC has been CD44, while the CSC marker in hematopoietic tissue is CD34.
- In general, purification of CSC by flow cytometry includes the combination of tissue-specific markers to distinguish and remove differentiated tumor cells and stemness markers to isolate the most primitive population (Figure 7).
- In addition, functional properties characteristic of stem cells can be measured using Flow Cytometry: Side Population (SP) analysis is based on the stem cell-specific activity of certain ATP-binding cassette transporter proteins, which are able to transport fluorescent dyes out of the cells.
- Many different transporters have been described and are assigned to seven subfamilies (A–G).
- Important members of this family are ABCB1 (multidrug resistance protein 1, MDR1), ABCC1, ABCF2, ABCB2, ABCC7, and ABCA5, which are upregulated in the SP of different cells and may vary from tumor to tumor.
- SP cells usually form a distinct small cell population (typically <0.1%) showing little or no fluorescence with vital DNA dyes like Hoechst 33342.
- Apart from Hoechst 33342, other vital dyes may also be useable like SYTO-13 or rhodamine 123 (Rh123), which was first introduced into stem cell research by Udomsakdi et al. in 1991.
- A dual-dye efflux strategy using Hoechst 33342 and Rh123 has been described for isolating cells with the highest hematopoietic stem cell activity.
- Furthermore, the stem cell-specific expression of aldehyde dehydrogenase (ALDH) can be used for CSC labeling.
- High ALDH levels have been reported for normal and cancer precursor cells of various lineages, including hematopoietic, mammary, endothelial, mesenchymal, and neural.
- CSC identification should be the result of using several markers and properties in combination.
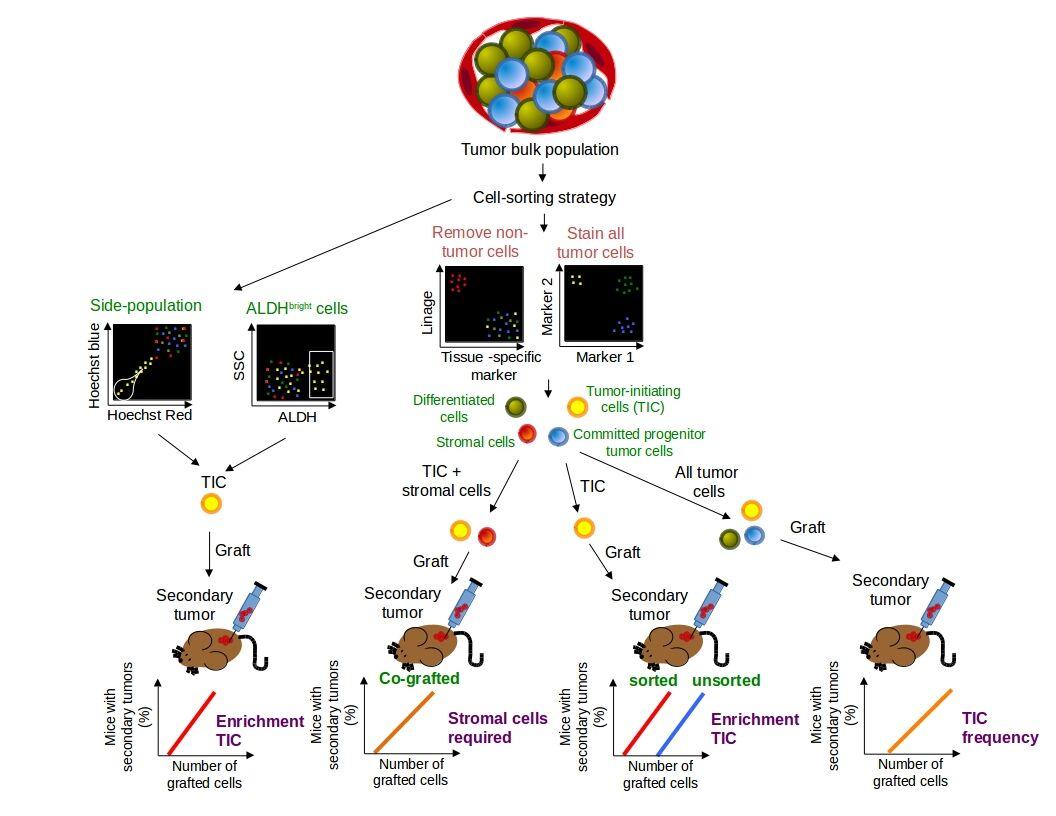
Table 1: Overview of CSCs markers suitable for the flow cytometric analysis. Taken from (Greve et al. 2012).
[table id=172 /]
Quiz (you will need to read the supplied paper)
Faculty Presentations:
Relevant Resources:
Related Link
Introduction to Flow Cytometry – BD BioSciences
- Beck, Benjamin, and Cédric Blanpain. 2013. “Unravelling Cancer Stem Cell Potential.” Nature Reviews. Cancer 13 (10): 727–38.
doi:10.1038/nrc3597. - Bendall, Sean C, Erin F Simonds, Peng Qiu, El-ad D Amir, Peter O Krutzik, Rachel Finck, Robert V Bruggner, et al. 2011. “Single-Cell Mass Cytometry of Differential Immune and Drug Responses across a Human Hematopoietic Continuum.” Science (New York, N.Y.) 332: 687–96.
doi:10.1126/science.1198704. - Goodell, M A, K Brose, G Paradis, A S Conner, and R C Mulligan. 1996. “Isolation and Functional Properties of Murine Hematopoietic Stem Cells That Are Replicating in Vivo.” The Journal of Experimental Medicine 183 (4): 1797–1806.
https://www.ncbi.nlm.nih.gov/pubmed/8666936 - Greve, Burkhard, Reinhard Kelsch, Kristina Spaniol, Hans Theodor Eich, and Martin Götte. 2012. “Flow Cytometry in Cancer Stem Cell Analysis and Separation.” Cytometry. Part A : The Journal of the International Society for Analytical Cytology 81 (4): 284–93.
doi:10.1002/cyto.a.22022.